Extended Description
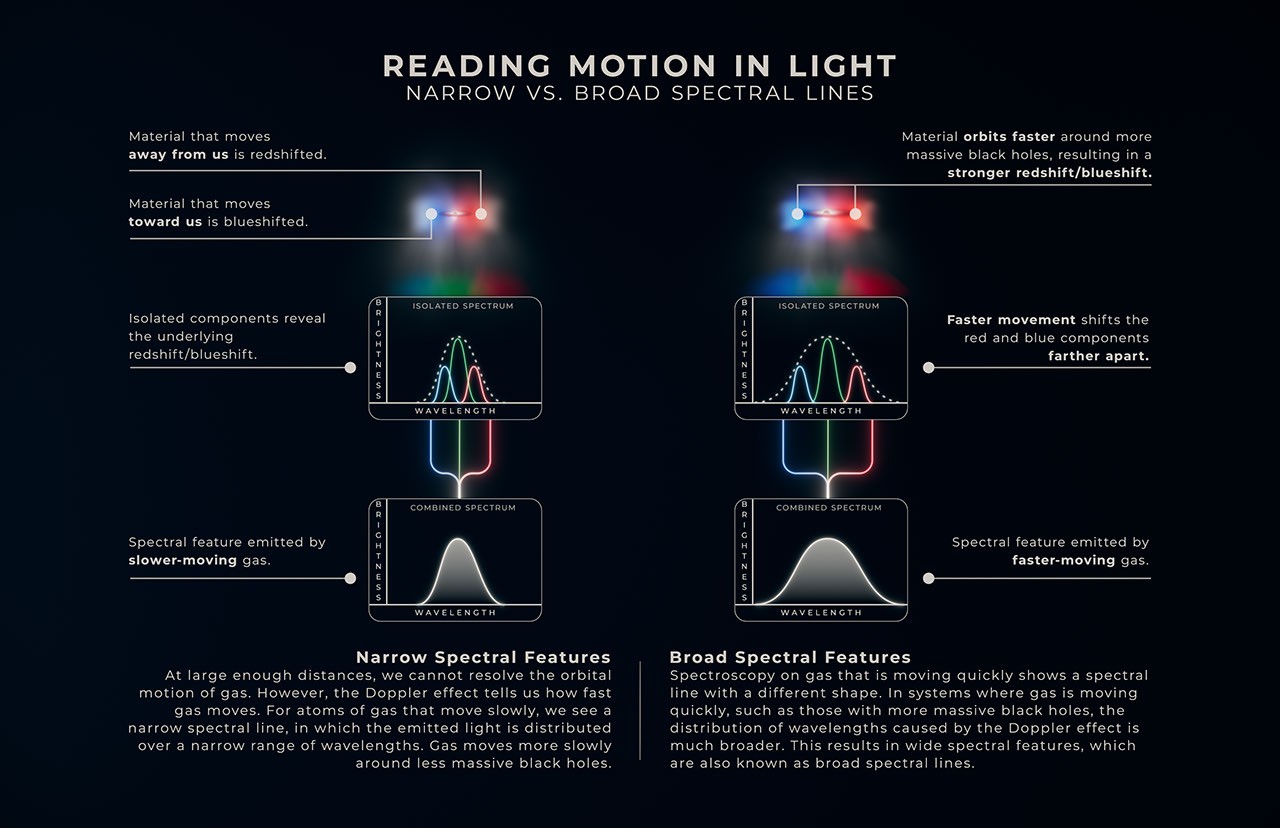
Infographic Title: “Reading Motion in Light, Narrow vs. Broad Spectral Lines”
The infographic is divided into two columns, focusing on the phenomena that lead to narrow spectral features on the left and broad spectral features on the right.
Left Column: Narrow Spectral Features
-
Illustration: A black hole is depicted at the center as a bright, fuzzy spot surrounded by a cloud of dust and gas. The right side of the cloud appears reddish (redshifted, indicating material moving away), while the left side is blue (blueshifted, indicating material moving toward us). A thin dark disk of material is seen edge-on around the black hole.
-
Graph:
- Title: “Isolated Spectrum”
- Axes: X-axis labeled “Wavelength,” Y-axis labeled “Brightness.”
- Curves: Blue and red curves rise to about one-third of the graph’s height, with a green curve overlapping and peaking slightly higher. A dotted white curve forms a broader profile.
- Caption: “Isolated components reveal the underlying redshift/blueshift.”
-
Combined Spectrum:
- Graph: A single curve identical to the dotted white curve from the first graph.
- Caption: “Spectral feature emitted by slower-moving gas.”
-
Text:
- Title: “Narrow Spectral Features”
- Content: Explains that at large distances, the orbital motion of gas cannot be resolved, but the Doppler effect indicates the speed of gas movement. For slower-moving gas, emissions manifest in narrow spectral lines, common around less massive black holes.
Right Column: Broad Spectral Features
-
Illustration: Similar to the left column, shows a black hole with a dusty cloud. The notation indicates that material orbits faster around more massive black holes, leading to stronger redshifts and blueshifts.
-
Graph:
- Title: “Isolated Spectrum”
- Axes: Same as in the left column.
- Curves: Much like the left column, but the caption indicates a faster movement affecting the wavelength distribution.
- Caption: “Faster movement shifts the red and blue components farther apart.”
-
Combined Spectrum:
- Graph: A single curve identical to the dotted white curve in the left column, representing faster-moving gas features.
- Caption: “Spectral feature emitted by faster-moving gas.”
-
Text:
- Title: “Broad Spectral Features”
- Content: Discusses how spectroscopy of rapidly moving gas leads to a different spectral line shape, with broader spectral features resulting from the Doppler effect, commonly observed in systems with massive black holes.
Image Alt Text
Infographic titled “Reading Motion in Light, Narrow vs. Broad Spectral Lines,” featuring two columns defining narrow and broad spectral features, accompanied by illustrations and graphs detailing the underlying principles.