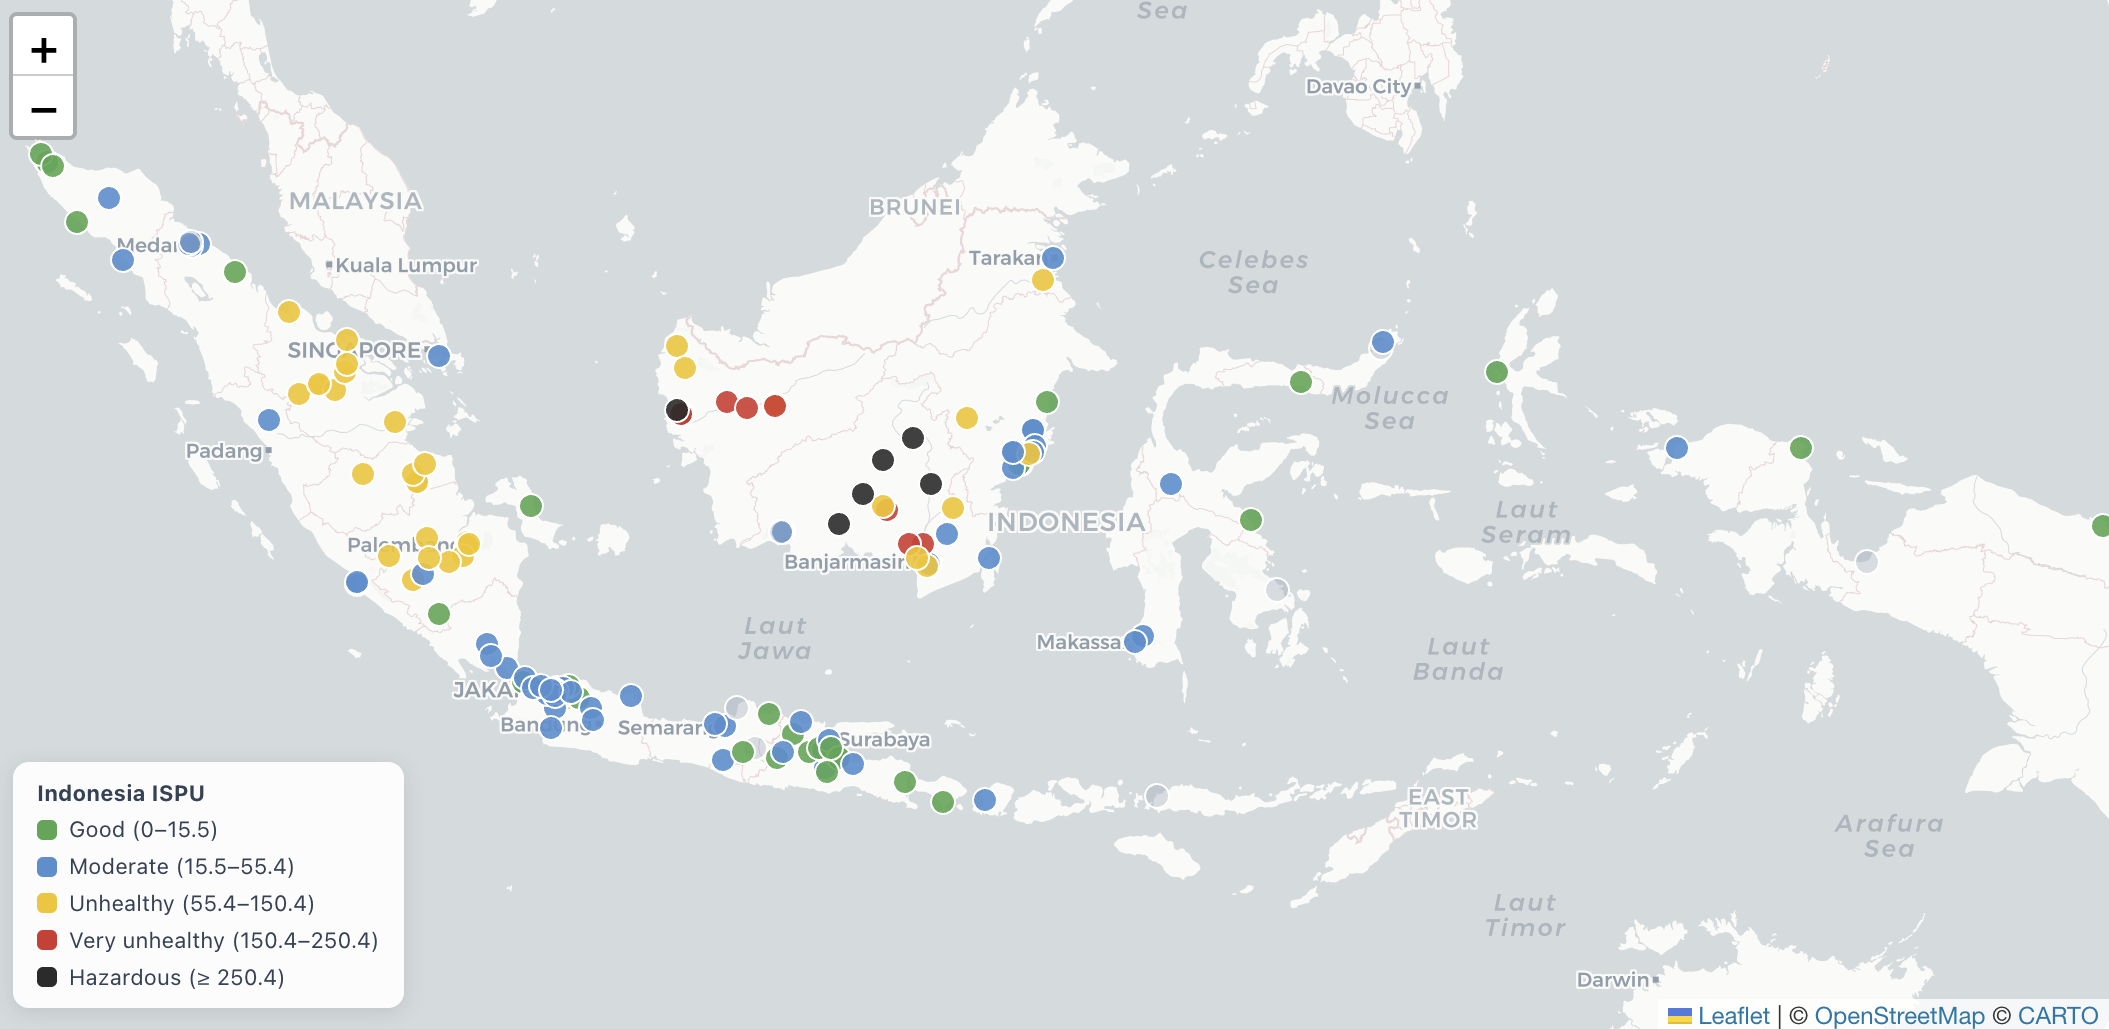
Monitoring the Air Quality in 13 Indonesian Cities During the 2026 Dry Season
This tool enables near-real-time tracking of air quality trends across 13 cities in Indonesia. Its primary aim is to assist researchers, policymakers, and local communities in recognizing trends during the El Niño phenomenon, which may worsen chronic air pollution issues.
Responsives
July 15, 2026
By Katherine Hasan, LinkedIn article: “Moderate Blue” and “Unhealthy Yellow”: Is the Current Air Quality Index Giving Indonesian Citizens a False Sense of Security?
July 24, 2026
By Katherine Hasan, LinkedIn article: “Predicting Jakarta’s 3-Day AQ is a Leap Forward — So Now What?”
The El Niño Impact
Understanding air pollution dynamics requires distinguishing long-term emission trends from seasonal variations. The El Niño-Southern Oscillation significantly aggravates air pollution across Indonesia. During El Niño phases:
-
Suppressed Rainfall: Delays in the monsoon season result in higher pollutant concentrations as rainfall typically cleans the air.
-
Increased Fire Activity: Drought conditions make peatlands and forests more susceptible to fires, causing large smoke and haze emissions, with transboundary pollution potentially affecting distant areas.
To mitigate the impacts of the 2026 El Niño, the Meteorology Agency of Indonesia (BMKG) advocates for a coordinated, multi-sectoral strategy that shifts from early warning to early action across various sectors.
Key Recommendations:
- Enforce anti-burning measures and monitor fire hotspots.
- Enhance PM2.5 air quality warnings and healthcare readiness for respiratory infections.
- Adjust agricultural practices to safeguard food security.
- Manage reservoir levels in the energy sector and diversify energy sources.
Key Issues:
- Rising PM2.5 and PM10 levels in Jakarta due to stagnant air.
- Increased fire incidents in wildfire-prone regions.
Methodology
Air Quality Data:
Data originates from government-operated monitors, ensuring readings are accurate and reliable through automated quality control processes.
Thermal Anomaly:
Fire activity is assessed using NASA’s thermal-anomaly data, measuring heat output from active fires.
Exposure Estimates:
Population exposure to air pollution is calculated using global PM2.5 data along with local corrections based on ground measurements to accurately reflect regional pollution levels.
For further methodology and data sources, refer to our data methodology document.
Disclaimer:
Maps on this website do not reflect any legal opinions about countries or territorial boundaries.
Contact Us:
For inquiries, reach out at getintouch@energyandcleanair.org.