Key Metrics
-
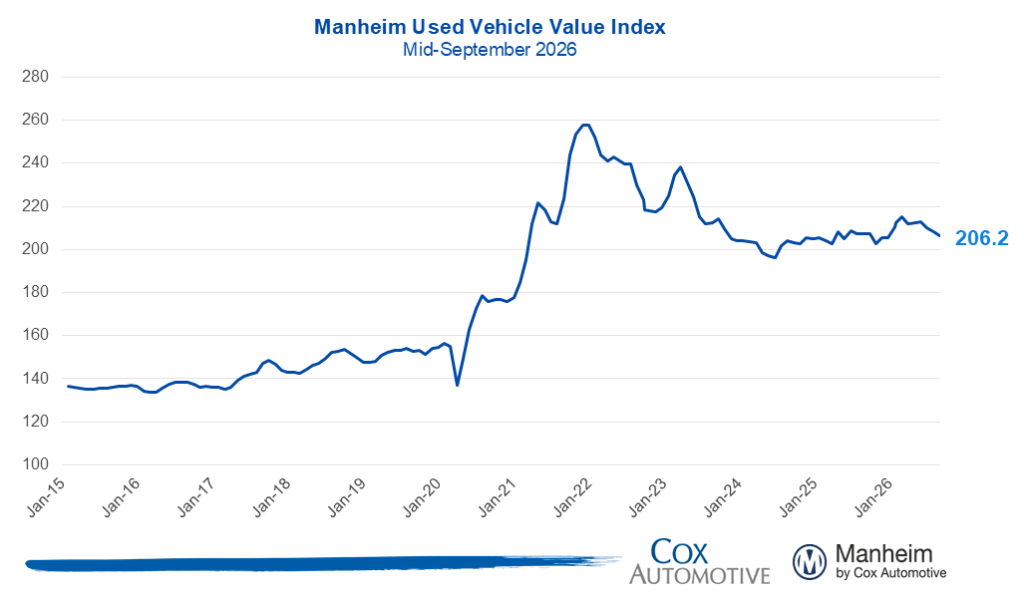
Manheim Used Vehicle Value Index (MUVVI): Fell to 206.2, reflecting a 1% decrease in wholesale used-vehicle prices in early September compared to August. Year-over-year, the index is down 0.4%.
-
Non-adjusted wholesale vehicle prices: Decreased 1.1% in the first half of September from August and are down 1.1% year over year. The typical monthly decrease for September is around 0.3%.
Expert Perspective — Jonathan Gregory, Senior Director, Cox Automotive
“Wholesale values decreased in the first half of September, with the Manheim index falling 1% from August. Year-over-year, this marks the first negative comparison for 2026, driven by a decline in demand and external economic pressures. Compact Cars and EVs show strength in prices, but overall, larger vehicle segments are experiencing declines.”
Key Insights:
- Rising gas prices are increasing demand for fuel-efficient vehicles.
- Higher borrowing costs due to a recent Federal Reserve rate hike may negatively impact vehicle demand.
MMR Prices, Retention & Sales Conversion
-
MMR Prices: Three-Year-Old Index decreased by 0.8% since early September, indicating a sharper decline compared to last year.
-
MMR Retention: Averaged 99.6%, showing a year-over-year increase.
-
Sales Conversion: Averaged 55.8%, which is down 1.4 points year over year.
Takeaway: Stable MMR retention but declining sales conversion suggests a softer demand environment.
Segment Performance: Year-Over-Year Price Changes
Overall, wholesale values saw declines, particularly in Midsize Cars, Pickups, and SUVs, even as Compact Cars and EVs increased slightly.
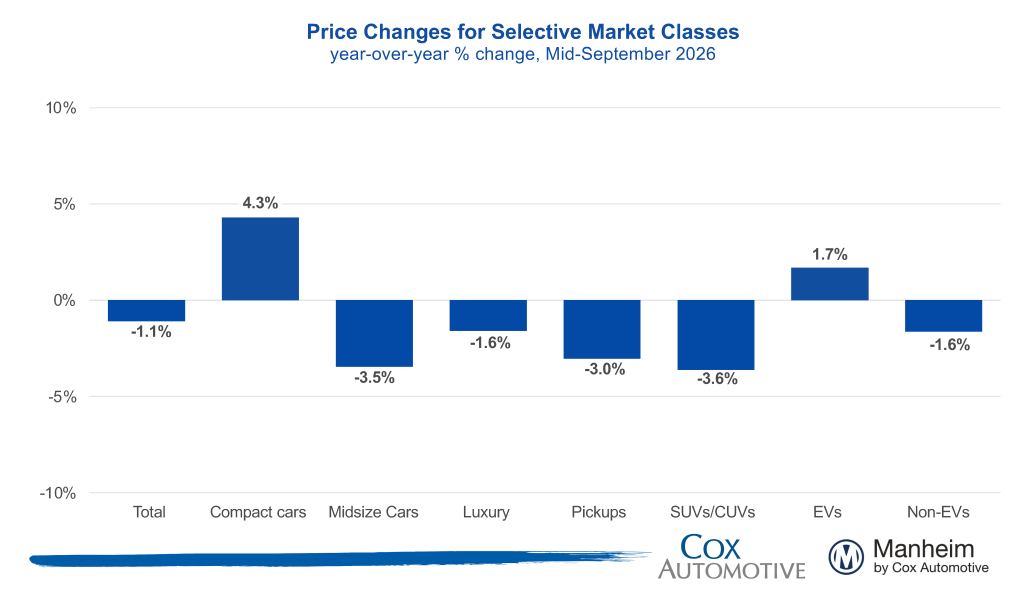
Takeaway: Compact Cars and EV values are holding steady compared to the previous year, but trends show a decline in momentum.
EV versus Non-EV Index
- EVs: The EV Index is up 2.3% year over year but down 1.3% from August.
- Non-EVs: The Non-EV Index is down 1.3% year over year and down 1.4% from August.
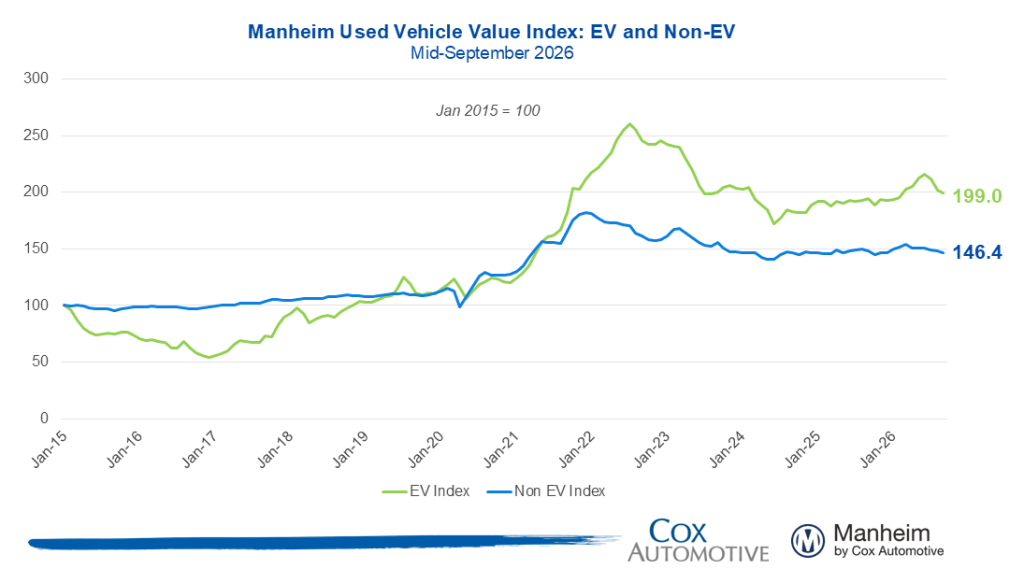
Takeaway: EV values are still above last year’s levels but are declining; availability is improving.
Wholesale Supply
- As of mid-September, wholesale vehicle supply has increased to 27.8 days, higher by approximately 2.4 days compared to last year.
Takeaway: Increasing days’ supply indicates a potential shift in market dynamics.
Additional Information
For a complete view of historical MUVVI reports, visit here. For inquiries, contact manheim.data@coxautoinc.com.
Note: The MUVVI was adjusted for improved accuracy as of January 2023. For details, learn more.