Key Metrics
-
Manheim Used Vehicle Value Index (MUVVI):
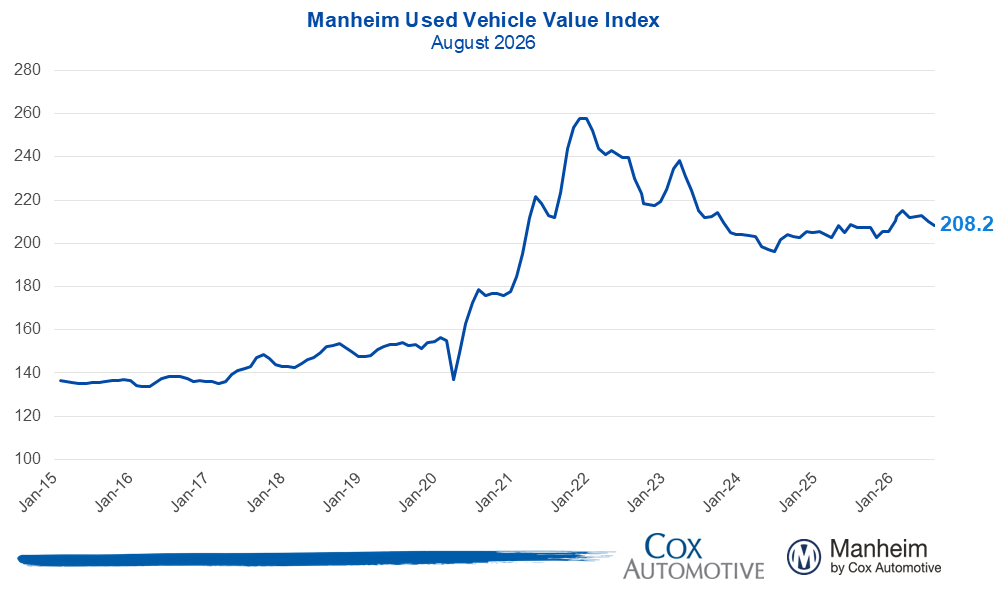
- August 2026 index stood at 208.2, with a 0.4% increase year-over-year but a 0.9% decrease month-over-month. The typical monthly change for August is a 0.5% increase.
-
Non-adjusted wholesale vehicle prices:
- Increased 0.2% year-over-year and decreased 0.5% from July 2026. The average monthly change for August is 0.1%.
Expert Perspective — Jeremy Robb, Chief Economist, Cox Automotive
- July and early August witnessed stronger depreciation trends, but the decline slowed later in the month.
- Younger vehicles experienced more depreciation, while older, affordable models saw less drop, indicating a rising demand for economical used cars.
- Retail sales of used vehicles rose throughout August, contributing to decreased retail days’ supply, which fell to 44 days from July’s 46 days.
Prices, Retention & Sales Conversion
- MMR Prices: Three-Year-Old Index decreased 1.8% in August.
- MMR Retention: Averaged 99.5%, a 0.3 percentage point decrease year-over-year, but a 0.3 percentage point increase from July.
- Sales Conversion: Recorded at 57.2%, down 2.8 percentage points from the three-year August average but up 3.5 percentage points from July.
Takeaway: MMR prices showed a greater decline than usual, with retention showing slight improvement but sales conversion indicating recovery from July, albeit still below average expectations.
Segment Performance: Year-Over-Year Price Changes
- Market prices showed slight growth driven by stability in EV and Compact Car segments, whereas Pickups and SUVs declined.
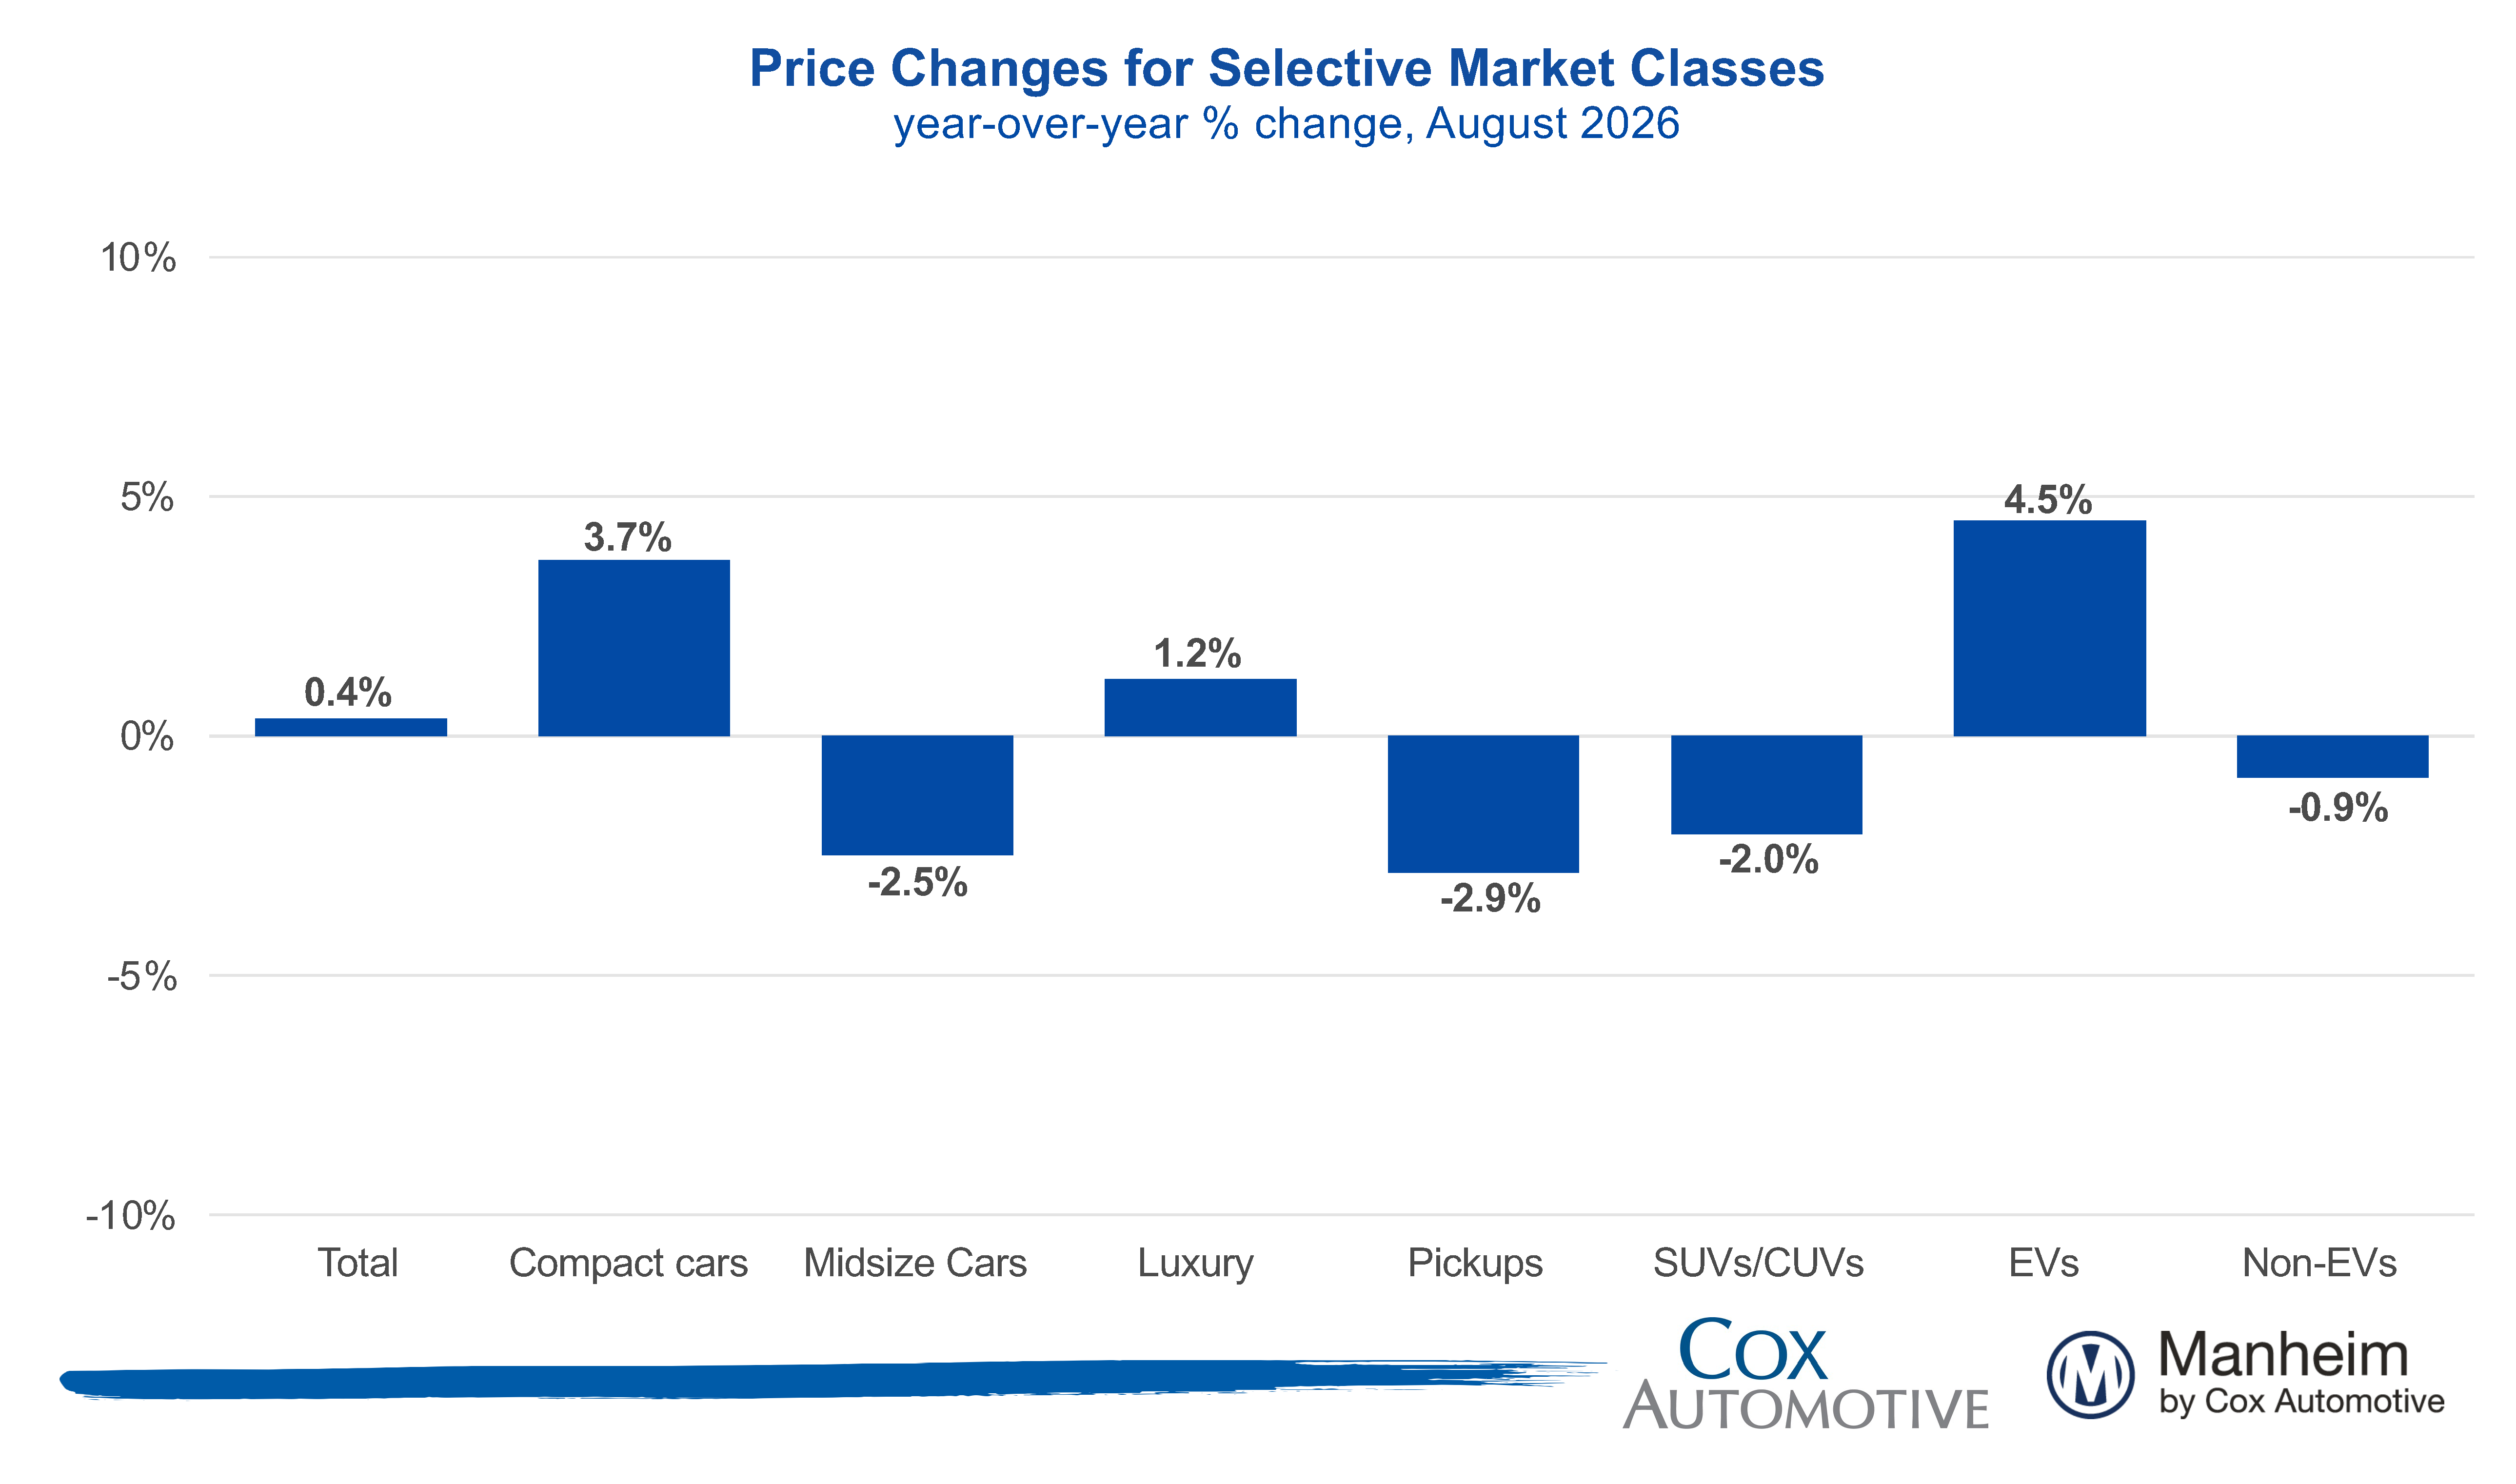
Takeaway: Despite recent declines, EVs illustrated resilience in the market.
EV versus Non-EV Index
- EVs: Index rose 4.5% year-over-year but fell 4.7% from July.
- Non-EVs: Index decreased 0.9% year-over-year and declined 0.6% from July.
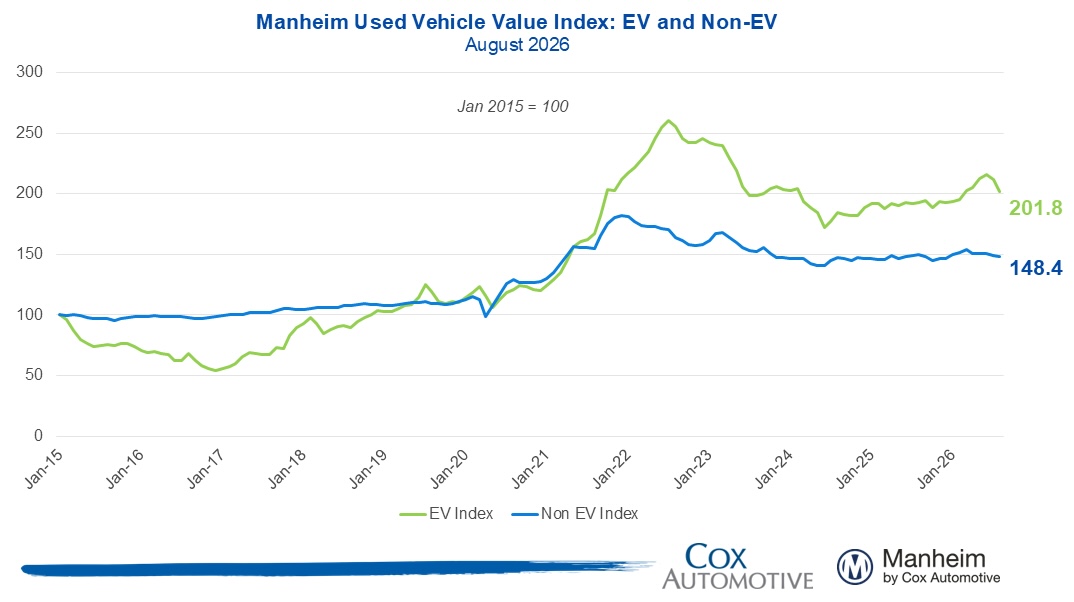
Takeaway: Both categories saw monthly declines; however, EVs remain above previous year’s levels, while Non-EVs did not.
Wholesale Supply & Rental Prices
- Wholesale Supply: Days’ supply ended at 27 days, up 2.3 days year-over-year and down 1.4 days from July.
- Rental Prices: Increased by 3.4% year-over-year, down 0.3% from July with values consistently above 2025 levels.
Takeaway: Supply days are elevated compared to last year but remain within seasonal norms.
Additional Resources
- For detailed historical MUVVI reports, visit here.
- More information can be found at MANHEIM.COM.
Note: The MUVVI will be adjusted for accuracy from January 2023 data release. For more details, learn here.