Artificial intelligence (AI) has arrived, and it is reshaping our world at an unprecedented pace. The capabilities of AI tools have advanced significantly, enhancing workflows across various fields. The software industry serves as a prominent example of this transformation. The era where programmers prided themselves on mastering complex programming syntax is now shifting. Today, prompt engineering—crafting intelligent prompts to harness AI’s capabilities—has emerged as the more desirable skill, as it promises substantial efficiency gains.
But how does this translate to personal finance? Can AI tools elevate the skills of everyday retail investors? This is a nuanced question, particularly since it concerns your hard-earned money. While AI tools have certainly improved in maturity and power, they are still prone to inaccuracies and can generate erroneous outputs. In our exploration of various free AI tools, we found them to be incredibly useful for swift analyses, gathering online data, building stock-screeners, and performing complex calculations—all of which are invaluable for time-pressed investors. However, these tools can also be unreliable, making it unwise to base real financial decisions solely on AI-generated analyses.
The optimal approach is to utilize AI outputs for quick insights, treating them as a foundation for deeper personal analysis. This perspective highlights the potential benefits of integrating AI into your personal finance toolkit. Below, we present several straightforward use-cases for fundamental investors to begin with, while also emphasizing the limitations of AI tools to help you navigate potential pitfalls.
Sector Primers
When venturing into a new sector, having a succinct primer can be invaluable. For instance, we prompted Google’s Gemini to create an overview of the tire industry. Here’s a suggestion for a directive prompt to maximize the quality of the response:
Imagine you are a seasoned expert in the Indian tire sector. Generate a primer that discusses key aspects such as major players and their market shares, segments they serve, raw materials, input cost fluctuations, expected margins, and the industry’s cyclicality.
From this output, we gleaned several informative points:
- MRF, Apollo, CEAT, JK Tyre, and Balkrishna Industries collectively dominate over 85% of the organized market.
- MRF boasts the most extensive distribution network, while Apollo has a presence in Europe through its Vredestein brand; Balkrishna Industries leads in off-highway tires.
- Aftermarket sales yield higher margins compared to OEM sales.
- Natural rubber and carbon black—which derives from crude oil—are critical raw materials, with their price fluctuations directly affecting margins, typically ranging from 10% to 17%.
- The industry has a semi-cyclical nature, as OEM demand correlates with new vehicle sales (cyclical), while replacement demand follows wear and tear (non-cyclical).
AI can assemble such a primer in mere seconds, a task that would otherwise take days. You can also utilize the ‘Deep Research’ feature for more detailed analyses, though it typically requires several hours to produce results based on the given prompt.
Document Analysis
As a fundamental investor, immersing yourself in comprehensive documents such as annual reports and earnings call transcripts is essential. Fortunately, AI tools can simplify this process, and this is one of the most beneficial applications we’ve discovered.
We were interested in understanding how Maruti Suzuki’s cost structure and margins were affected in FY23, especially following the rise in crude oil and commodity prices due to the Russia-Ukraine conflict. Besides increased logistics costs, suppliers of forged and plastic components, reliant on crude derivatives, typically pass increased costs back to OEMs like Maruti. Thus, reviewing the FY23 annual report would provide crucial insights given our current context.
We uploaded the annual report to NotebookLM, a Google product known for its capability to generate answers primarily based on the documents provided. We discovered that the company did face commodity cost pressures but still managed to increase its EBIT margin from 3.5% in FY22 to 7.3% due to operating leverage (19% volume growth) and measured price increases.
Looking ahead to FY27, could FY23’s performance be replicated by Maruti? Back in FY22, sales volumes were hampered by semiconductor shortages, leaving the company with a relatively low base for FY23. However, in FY27, the same circumstances don’t apply, given that OEMs had a strong FY26 following GST cuts. Consequently, to maintain margins, Maruti’s only option appears to be increasing prices or reducing discounts. It’s crucial to closely monitor price adjustments and their potential impact on demand as a key indicator.
For accessing earnings call transcripts, you may want to explore Perplexity Finance, which offers transcripts for the last ten quarters under the ‘Earnings’ tab and categorizes them by topic. Topics such as management discussions, platform synergies, margin strategies in modules and polymers, as well as aerospace and semiconductor business strategies were among the points highlighted in Samvardhana Motherson’s Q3 FY26 earnings call.
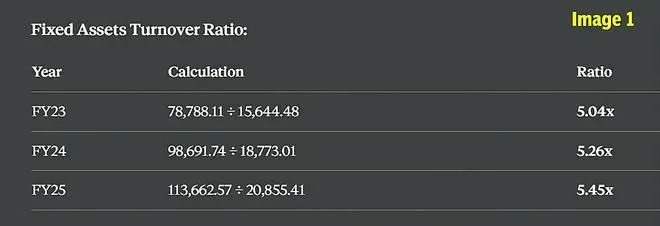
As another use-case, certain financial ratios like EBITDA margins and fixed asset turnover ratios aren’t typically included in quarterly earnings reports. By uploading relevant PDFs to your chosen AI model, you can quickly obtain these calculations. For instance, we prompted Claude to determine Samvardhana Motherson’s fixed asset turnover ratio for FY23-25, as shown in Image 1.
Post-Market Briefing
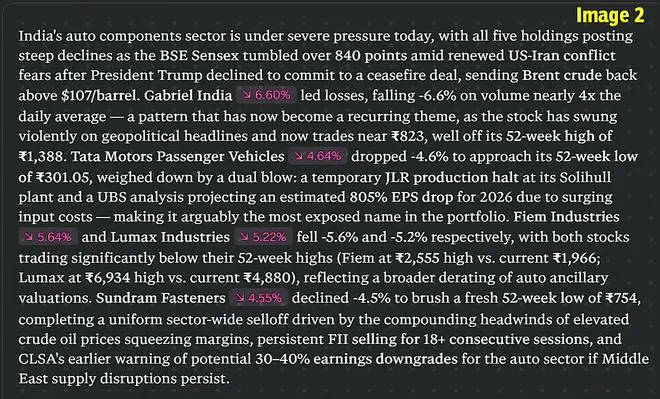
It’s impractical for retail investors to monitor the market continuously throughout the day. This is where tools like Perplexity Finance and Google Finance (Beta) can be valuable. After the trading day ends, you can receive a summary of your stock performance by simply creating a custom watchlist. Perplexity provides a ready-made summary under the ‘Watchlist’ tab, while Google Finance (Beta) requires a specific prompt for similar summaries. We created a watchlist featuring stocks from the auto sector on Perplexity Finance; refer to the market brief summary for March 27 in Image 2.
Stock Screening
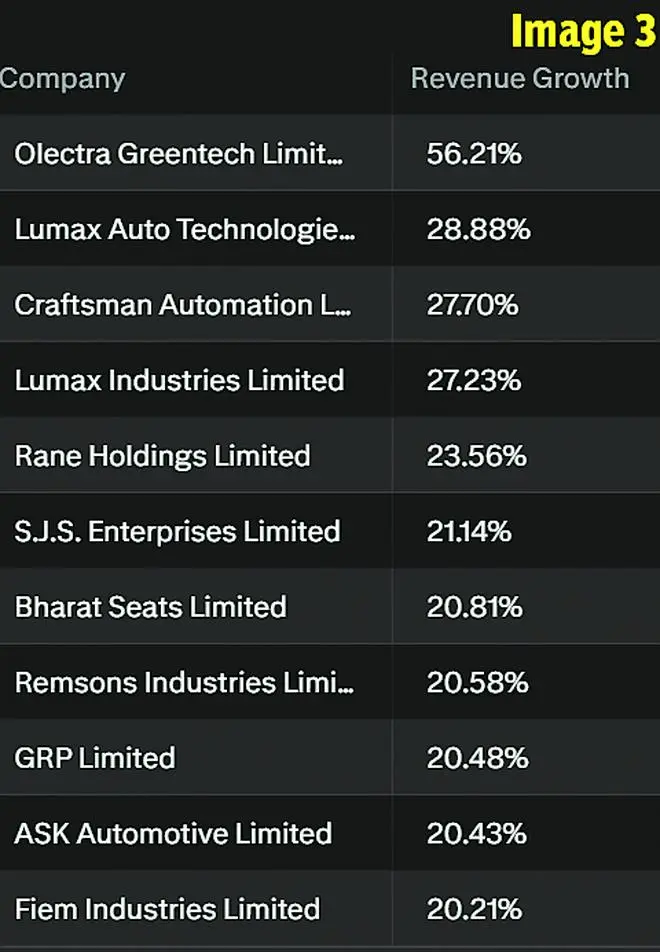
Implementing screeners for stock filtering is a fundamental step in a bottom-up investment strategy. While numerous free screeners are accessible online, they often come with fixed syntax that can be challenging for those lacking technical skills. For this specific task, Perplexity Finance’s ‘Screener’ feature simplifies the process by allowing you to formulate conditions in natural language. We conducted a basic screening query to identify high-growth auto ancillary stocks, shown below along with the output in Image 3.
Prompt: Filter auto ancillary companies that experienced revenue growth exceeding 20% in FY25.
DCF Simulations
For those who prefer the discounted cash flow (DCF) model for valuation assessments, AI tools can accommodate that as well. In essence, the DCF method involves discounting future free cash flows to estimate an investment’s value, based on your assumptions regarding various variables. Once you set these parameters, AI models can efficiently perform simulations, which can be particularly helpful for less spreadsheet-savvy investors.
Prompt:
Calculate Infosys’ market value per share using the DCF model, and specify if there’s any upside from the current market price of ₹1,275.
Assume the following values:
- Free cash flow to the firm (FCFF) for FY26 = ₹30,000 crore.
- FCFFs expected to grow at a rate of 5% from FY27 to FY30.
- Perpetual growth rate for FCFFs at 2%.
- The company is net-debt free, thus the cost of debt is nil.
- For the cost of equity, use a risk-free rate of 4.4%, an equity risk premium of 7.1%, and a beta of 0.9.
- Number of outstanding shares: 406 crore.
Without detailing the calculation steps, we summarize the output here:
Output: Expected per-share equity value = ₹951. At the current price, there is no margin of safety, as it exceeds the DCF-derived intrinsic value by approximately 34%.
Readers can modify this prompt by adjusting variables to run simulations for different scenarios, such as a bullish or bearish case.
Caveat Emptor
In this discussion, we have only scratched the surface of the vast capabilities AI offers, while acknowledging that the technology is still in its early stages and has several limitations. When considering the use of AI in your financial journey, you must be fully aware of its potential shortcomings, as a single erroneous assumption could jeopardize your portfolio. Below are some limitations we encountered during our trials with these models:
Charts displaying valuation multiples (like P/E and P/B ratios over time) can be invaluable. For instance, a time-series chart of P/E ratios based on daily prices helps contextualize current valuations relative to the past. We attempted to generate a daily P/B chart for SBI using Perplexity but ended up with a P/B chart limited to year-ends, complete with errors (see Image 4).
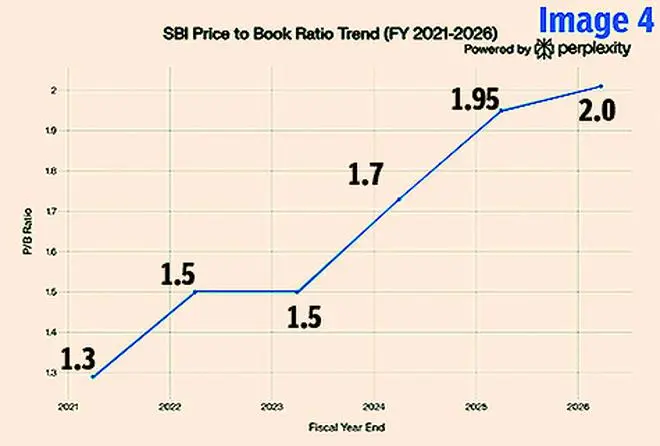
While most P/B values for FY21-24 were largely accurate, those for FY25 and the current metrics were not. The actual P/B ratio at FY25’s end is 1.4x, while the current ratio is 1.6x—as per Perplexity, those figures were inflated to 2x.
Next, we attempted to compare year-over-year revenue growth between TCS, Infosys, and HCLTech for the last four quarters. Though Perplexity has quarterly financial data under the ‘Financials’ section, it erroneously sourced information from the web, resulting in inaccuracies (see Image 5).
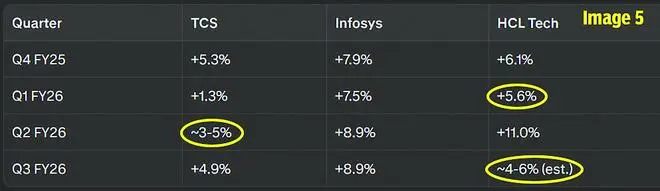
Please note, TCS recorded a 2.4% revenue growth in Q2 FY26, while HCLTech’s revenues increased by 8.2% in Q1 FY26 and 13.3% in Q3 FY26.
Taking a second look at Image 3, we noticed Olectra Greentech was included, although it operates as an OEM rather than a supplier of automotive components.
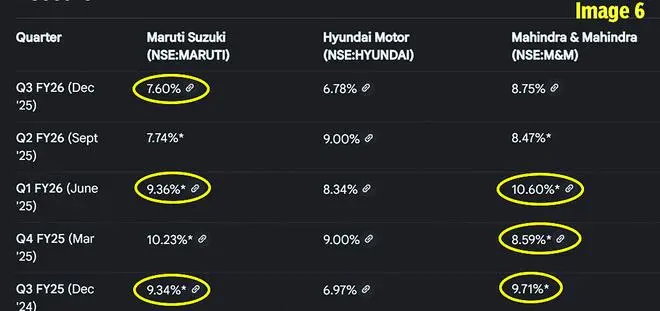
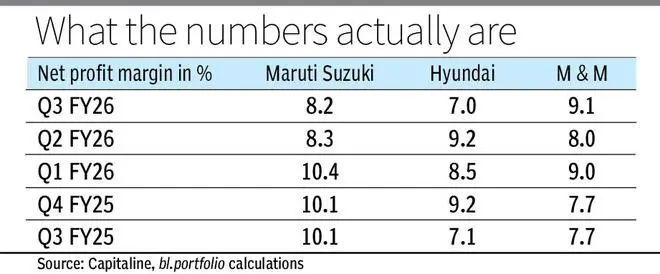
We also prompted Google Finance (Beta) to calculate net profit margins for Maruti Suzuki, Hyundai, and Mahindra & Mahindra over the last five quarters. Similar to Perplexity, Google Finance houses quarterly financial data but also relied on web sources for its calculations. While some values were close to accurate, others were noticeably off (see Image 6 along with the infographic table).
While other challenges exist, it’s clear that the benefits of AI tools for retail investors are too significant to ignore. We encourage readers to treat these AI platforms as an additional resource in their investment journey, continually experimenting until they find effective, reliable workflows that suit their needs.
The mention of AI products in this article is not intended as endorsements or criticisms.
Published on March 28, 2026