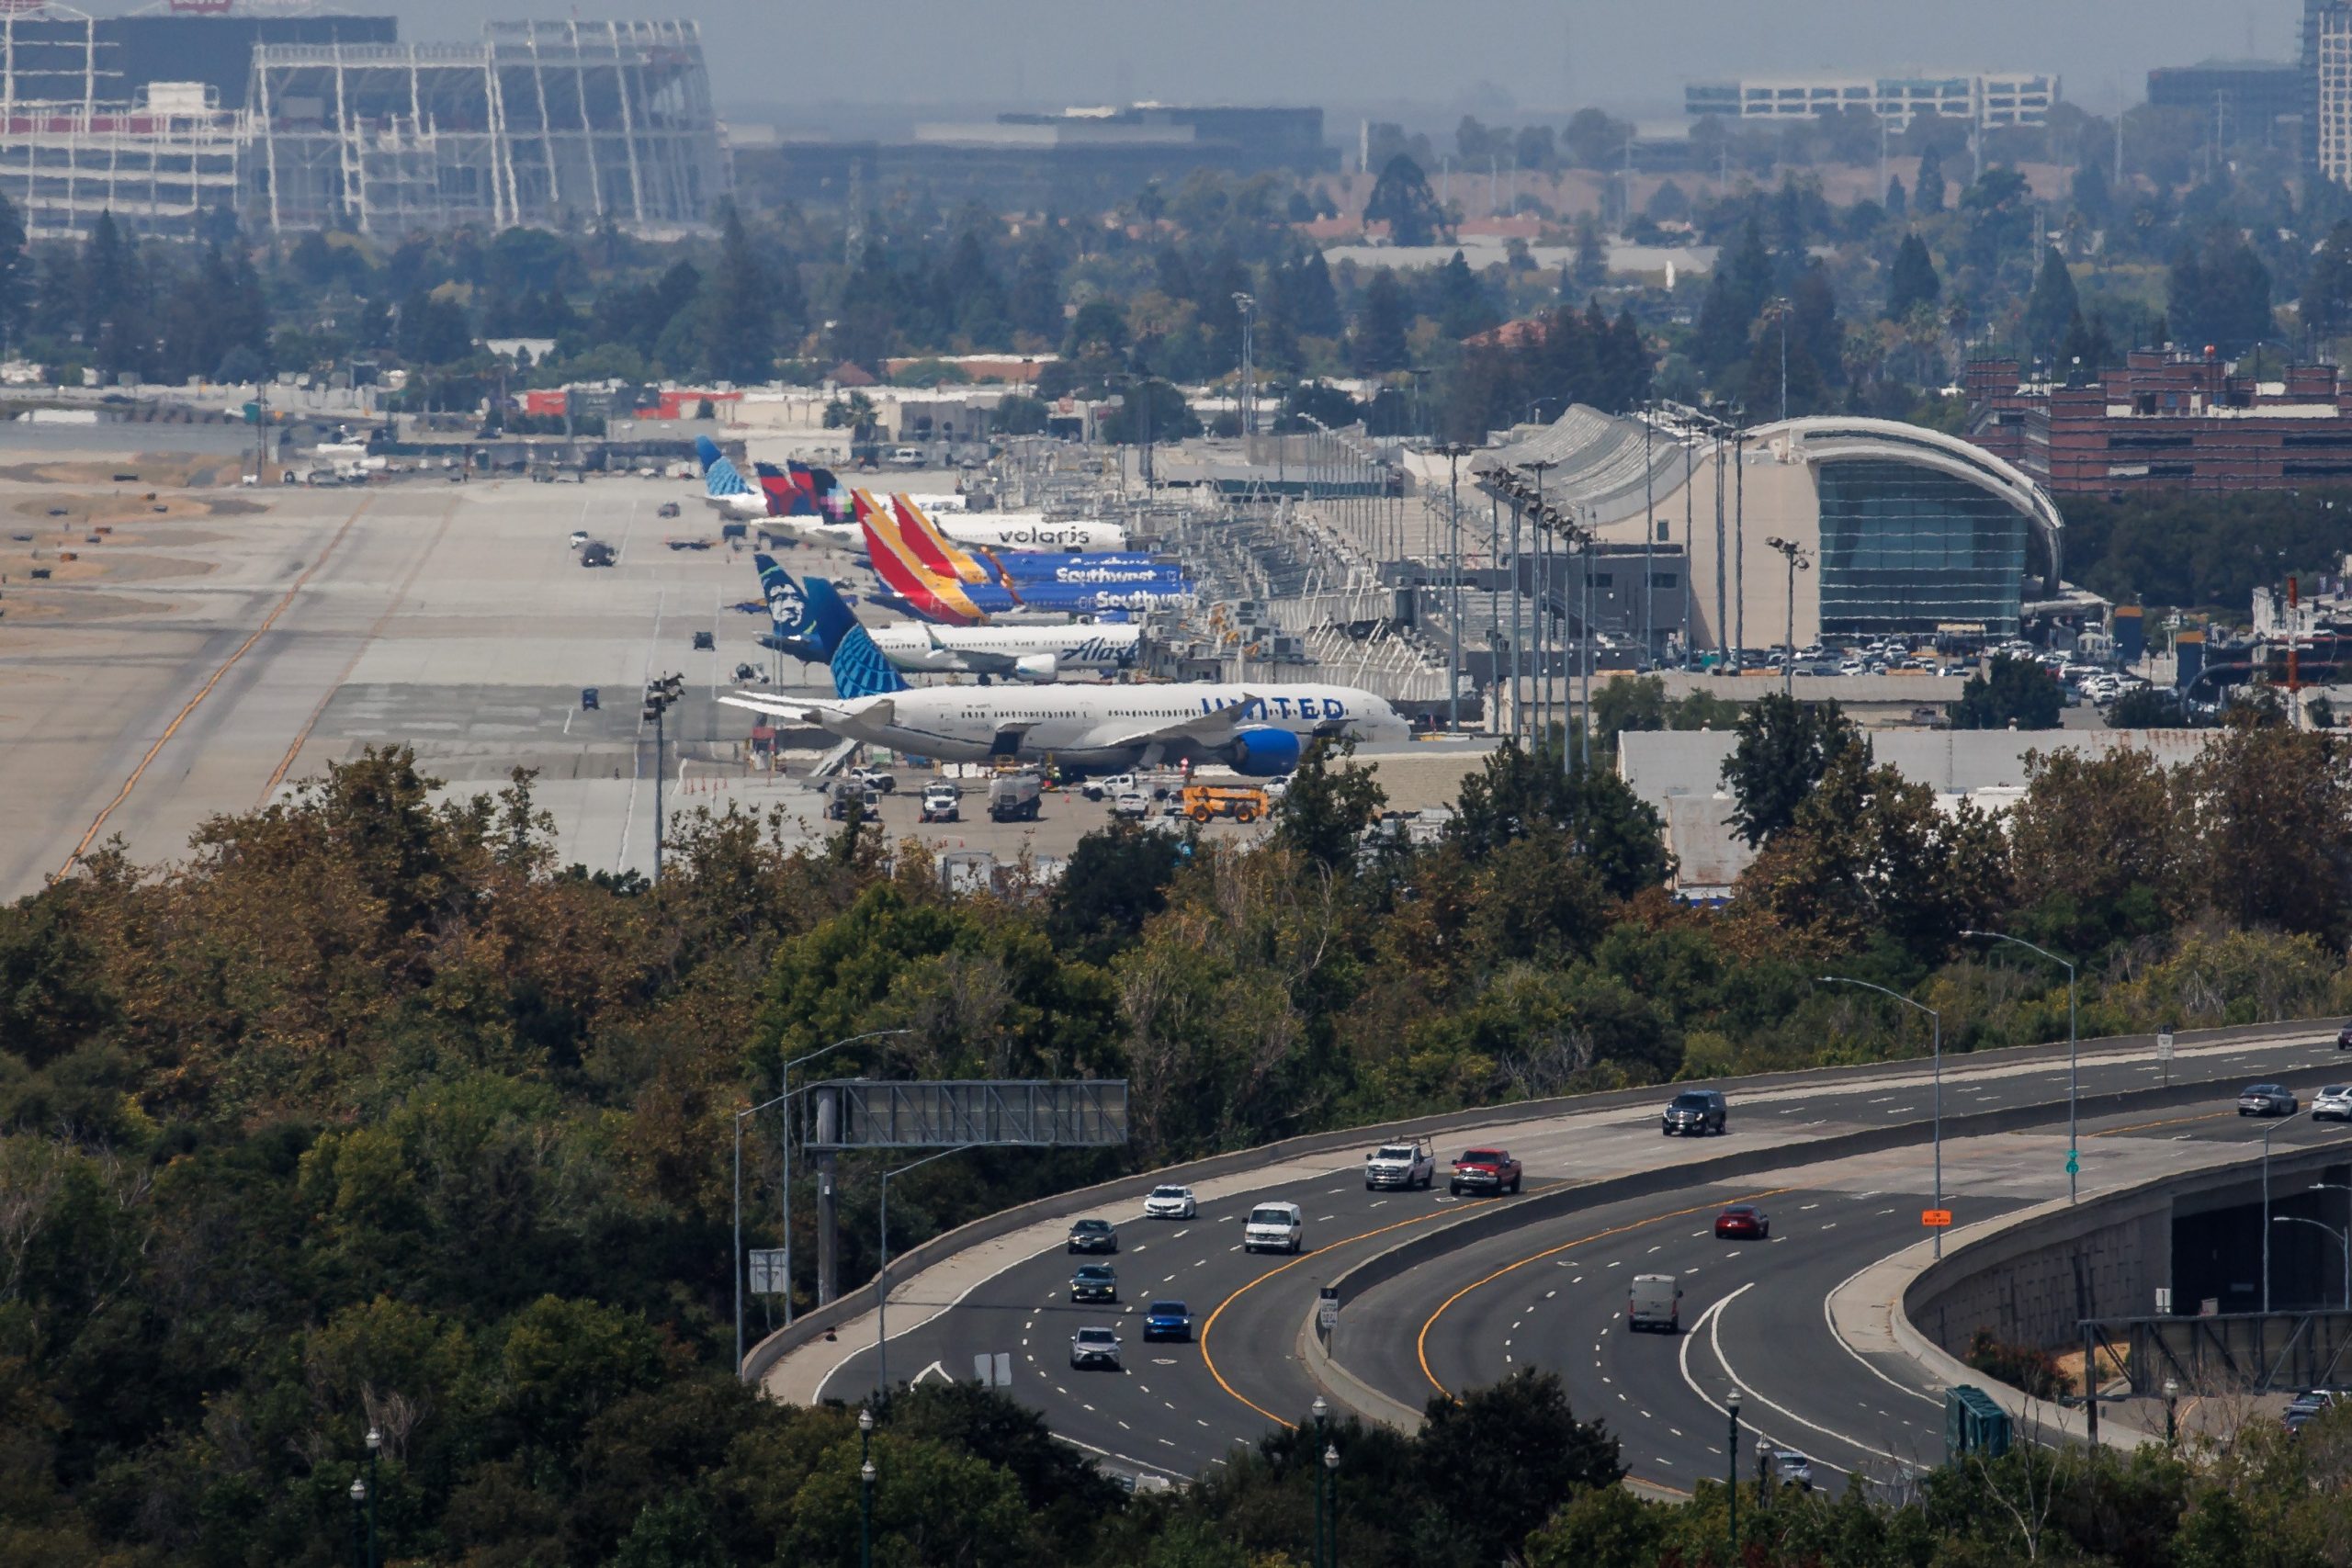
Summary of August Passenger Trends at Bay Area Airports
In August, all three major Bay Area airports experienced a drop in passenger trips due to the conclusion of significant events, like the World Cup, in July.
-
San Jose Mineta International Airport
- Passengers: ~865,000
- Change from August 2025: Down 11.2%
- Change from July: Down 7.4%
- Yearly total (ending August): 9.91 million (down 11.5% from 2025)
-
Oakland International Airport
- Passengers: ~684,300
- Change from August 2025: Down 15.6%
- Change from July: Down 3.8%
- Yearly total (ending August): 8.28 million (down 13.7% from 2025)
-
San Francisco International Airport
- Passengers: ~5.03 million
- Change from August 2025: Up 4.1%
- Change from July: Down 5.2%
- Yearly total (ending August): 55.31 million (up 1.7% from 2025)
Year-on-Year Performance
- San Jose and Oakland have seen consistent declines over the past year, while San Francisco shows growth.
Comparison to 2019
- San Jose: Down 36.7%
- Oakland: Down 38.1%
- San Francisco: Down 3.8%
Despite improvements for San Francisco, all airports remain below pre-pandemic passenger levels.