In today’s investment landscape, a well-rounded asset allocation strategy must not overlook international equities. Over half of the global equity market capitalization exists outside of the United States, presenting both opportunities and challenges for investors keen to diversify. The complexity arises in the sheer number of options available for international investment, with nearly 900 mutual funds and around 80 ETFs classified as “international” stock portfolios, according to Morningstar. And this number continues to grow.
Recent introductions of two new ETFs from State Street and Vanguard simplify this decision-making process. The SPDR MSCI ACWI ex-US (CWI) and Vanguard FTSE All-World ex-US (VEU) provide investors with a single package that encompasses all non-U.S. equities, combining developed and emerging markets. For those interested, the Vanguard ETF is also offered as a mutual fund under the ticker VFWIX.
This approach, while common in mutual funds, is relatively new to ETFs. It appeals to investors looking for a comprehensive foreign stock option akin to the Russell 3000 or S&P 1500 for U.S. equities.
Your editor engaged in discussions with representatives from State Street and Vanguard regarding these innovative international ETFs in the March issue of Wealth Manager. To deepen your understanding of these products, read more here.
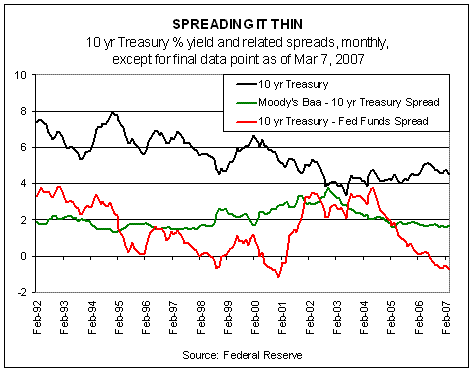
As risk takes center stage in today’s capital markets in light of recent equity volatility, the allure of this risk comes with cautious reflections, particularly when we look at yields from debt securities. Currently, the 10-year Treasury yield sits below 4.6%, offering little encouragement for long-term holdings. With inflation diluting nearly half of the yield, the incentive to invest is diminished.
Moreover, there’s been a reluctance to delve into lower-rated debts in search of higher yields. Last week, Moody’s Baa-rated corporate bonds yielded around 6.16%, only 166 basis points above the 10-year Treasuries. This narrow risk premium is the slimmest seen since the late 1990s.
The sharp decline that affected the global equity markets on the last day of February was startling; however, it hasn’t led to substantial losses across the board this year. An analysis of 2007’s performance through March 8 indicates some dips, notably within riskier segments. Emerging markets specifically are down 2.5% for the year, with Europe’s emerging markets leading the downturn at a loss of 7.7% as of March 8. Overall, the markets have remained mostly flat according to S&P/Citigroup Global Equity Indices.
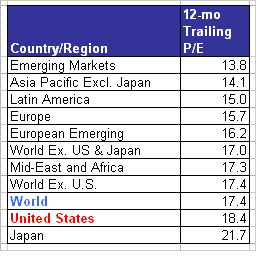
What does the valuation landscape look like globally as of the end of February? Starting with price-to-earnings ratios, emerging markets appear most attractive on a comparative basis with a trailing P/E of 13.8 as of February 28, slightly reduced from 14.5 at the year’s end. Conversely, the more expensive markets hover above a P/E of 17, with Japan approaching 22. (All P/E and fundamental data are derived from S&P/Citigroup Global Equity Indices dated February 28, 2007.)
While the presidential election is still over a year away, a new wave of controversy is surfacing, particularly surrounding finances. A junior senator from Illinois recently faced scrutiny for making questionable investments totaling up to $100,000 in two small firms owned by political contributors. Although Senator Barack Obama did not make these trades personally, he relied on an advisor through a so-called blind trust.
A blind trust is meant to shield investors, such as a U.S. senator, from any political or ethical backlash resulting from their investments. Unfortunately for Obama, this ideal is now under fire as the media questions him about the old adage: What did he know and when did he know it?
The realm of investment portfolio management is rich with various ideas, theories, and strategies. However, regardless of your approach to managing wealth, an increasing number of independent financial advisors advocate for the integration of Monte Carlo analysis into the process.
What is Monte Carlo analysis? Essentially, it’s a statistical method used to estimate the probability of different outcomes. For a more detailed exploration, you can find exhaustive resources online by clicking here. Thanks to advancements in computing over the past generation, Monte Carlo analysis is more accessible and affordable than ever. Many financial advisors utilize this method to evaluate the likelihood that an asset allocation strategy will meet its objectives. One noteworthy application involves adjusting portfolios to enhance the probability that investors will not deplete their resources.
While embracing Monte Carlo analysis presents many benefits, it’s essential to recognize that there are no shortcuts in statistics. In the February issue of Wealth Manager, your editor discussed its applications in an article titled “A Sure Bet?” concluding that while powerful and revealing, Monte Carlo analysis comes with risks, particularly due to the inherent subjectivity involved. For further details, read more here.
Yesterday’s update on the ISM Non-Manufacturing Index for February indicates that the economy is experiencing a slowdown, potentially more significant than anticipated. The services sector index, which represents 80% of the economy, fell to 54.3 from 59. A reading above 50 signifies growth; thus, this is the most considerable decline in percentage since September 2005.
However, the dynamics of the economy are complex. Keeping analysts engaged, the ISM Manufacturing Index for February, released last week, reported an uptick to 52.3 from 49.3, marking a significant rebound from the previous month’s contraction. This rebound suggests that manufacturing activity may hold steady, if not improve.
Nonetheless, drawing firm conclusions remains risky in the realm of economic forecasting, particularly at this stage in the cycle. The ISM Manufacturing Index has dipped below 50 twice in recent months, indicating a rather uncertain outlook. Traders must make timely assessments, and a resurgence of doubt about the economy’s trajectory for 2007 has led bond traders to anticipate potential interest rate cuts later this year. The July Fed fund futures contract now reflects expectations of a 5% rate, 25 basis points lower than the current rate.
Yet, caution among bond investors is warranted; St. Louis Fed President William Poole recently remarked that “neither the mainstream forecasters in government nor elsewhere predict a recession on the horizon.” He stated in The Herald Tribune/AP.
Last week proved challenging for the capital markets by almost any measure. As our table below illustrates, March began with a surge of investors repricing risk in a decidedly unfavorable manner. Of the major asset classes, only cash, TIPS, and bonds managed to escape the downturn.
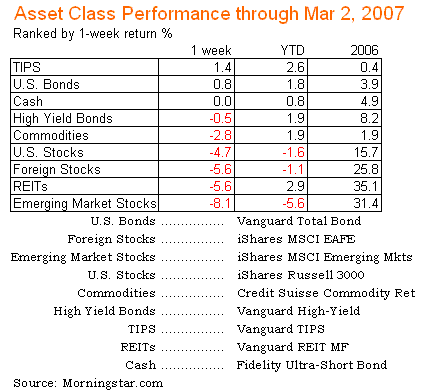
Year-to-date figures don’t paint quite as bleak a picture. The pressing question is whether the losses will deepen or if bulls will reassert themselves. Market movements will likely be influenced by this week’s economic reports, including the ISM Non-Manufacturing Index update. While manufacturing has shown weaknesses, the robust health of the services sector holds more weight, given its larger share of the economy. Additionally, the upcoming non-farm payrolls report for February adds another layer of intrigue.
Volatility has returned. As uncomfortable as it may be, this is not entirely unexpected. As noted in previous blog entries, I have maintained a significant cash position, aiming to capitalize on potential rebalancing opportunities. Whether the current downturn marks an extraordinary opportunity remains uncertain, but it certainly shapes up as a promising scenario early in the year.
I apologize for the abrupt timing, but I will be stepping away for a few days. Predictably, as I make my way to Los Angeles, the market has taken a downturn. Perhaps taking a short break from writing will offer a fresh perspective. Rest assured, I will return on March 5 for more insights. In the meantime, Tuesday’s drop in stocks serves as a reminder of the value of including bonds in a balanced asset allocation strategy due to their low correlation with equities. This principle was highlighted when the iShares Lehman Aggregate Bond ETF posted a modest gain on a day dominated by stock losses. Clearly, the merits of diversification among asset classes are reaffirmed.
What connects the Chinese stock market to the U.S. subprime mortgage market? On the surface, little. However, both have enjoyed prolonged rallies before recently hitting significant hurdles.
This has led to a noteworthy realization: even markets that have thrived can experience tough times. Bear markets have not been eliminated from the equation, despite appearances to the contrary.
While predictions about future movements remain speculative, historical trends offer solid context. The fact that both the Chinese and subprime mortgage markets have stumbled could be viewed as isolated incidents. Yet, they may serve as early warnings of broader market shifts. Clearly, this viewpoint comes with inherent risks, but considering the reality that bull markets cannot endure indefinitely lends weight to this perspective.
The inverted yield curve has been present for so long that many investors have grown accustomed to it, often overlooking its historical implications. Just when it seemed that a 10-year Treasury yield trading below the Fed funds rate was inconsequential, former Fed Chairman Alan Greenspan’s comments remind us otherwise.
“When you get this far away from a recession, forces begin to accumulate for the next recession, and we are starting to see those signs,” Greenspan stated at a business conference recently. “For example, profit margins in the U.S. are beginning to stabilize, which is an early indication that we are in the later stages of the cycle,” he remarked to The International Herald Tribune. “While it’s possible we could see a recession in the latter part of 2007, most forecasters are looking towards 2008 with predictions of a slowdown.”
Greenspan’s remarks come in the context of his previous assertion that the worst of the housing correction was behind us. Not long after, various analysts began to suggest that the economy appeared stronger than anticipated. The surprisingly strong fourth-quarter GDP report supported continued growth, but the extent of Greenspan’s influence on economic sentiment is up for debate.
The stock market is surely searching for justification for a correction, and Greenspan’s views certainly provide that. Notably, the S&P 500 has maintained a strong upward trend and is nearing its previous high from March 2000. Historically, the markets have exhibited a tendency to retreat as they approach prior peaks, and while I believe the S&P will eventually reach new heights, I am uncertain that a record will happen by the seventh anniversary of its last peak.