Market Movements and Economic Indicators
This week revealed new economic indicators that could significantly impact the financial landscape. While these numbers may not offer a truthful representation of reality, they can greatly sway the stock and bond markets in today’s centrally planned economy.
Inflation Data Released
On Tuesday, the Bureau of Labor Statistics released the most recent inflation figures. According to the government’s data, consumer prices, as reflected by the Consumer Price Index (CPI), increased at an annual rate of 7.1 percent in November. After peaking at 9.1 percent in June, the CPI has been on a consistent decline.
Initially, Wall Street responded positively to this news, with the S&P 500 rising 155 points to reach a temporary peak of 4,145. However, it soon decreased by over 122 points, closing the day at 4,022.
Investors believed they had deciphered a hint from the CPI report about the Federal Reserve’s decisions during the upcoming Federal Open Market Committee (FOMC) meeting. Most anticipated that the Fed would raise the federal funds rate by 50 basis points, or 0.5 percent.
The CPI figure of 7.1 percent led many to speculate that a pause or slowdown in rate hikes might be forthcoming, possibly at the next FOMC meeting on February 1, 2023, or even at the subsequent meeting on March 22.
This interpretation might seem absurd, but in an economy driven by central planners rather than market forces, such hints become crucial.
The Fed’s Response
At the FOMC meeting on Wednesday, Fed Chair Jerome Powell confirmed the expected 0.5 percent interest rate hike. Alongside this, he stated, “The Committee is strongly committed to returning inflation to its 2 percent objective.”
Recently, some advocates for currency devaluation have suggested that the Fed should raise its inflation target. In their view, lowering inflation from 7.1 percent to 4 percent seems more achievable than dropping it to 2 percent. The rationale behind raising the target remains unclear, but it highlights the central bankers’ overestimation of their control over economic variables.
During the press conference, a journalist queried Powell about altering the Fed’s 2 percent inflation target. ZeroHedge provided a summary of Powell’s response, which created a stir in the markets:
- Powell initially stated they wouldn’t consider changing the target under any circumstances, but added, “it may be a longer-run project at some point.”
Wall Street was left uncertain by his remarks, ultimately leading to an erratic day for the S&P 500, which ended with a loss of 24 points, followed by a 100-point drop on Thursday.
While investors welcomed the possibility that peak inflation might be behind us, they began to ponder whether a deflationary recession looms ahead.
Yield Curve Inversion
After unprecedented monetary expansion amounting to around $5 trillion during 2020-21, the Fed is now undergoing a significant contraction phase. In 2022, it raised the federal funds rate by a total of 4.25 percent, which has also influenced the Treasury market.
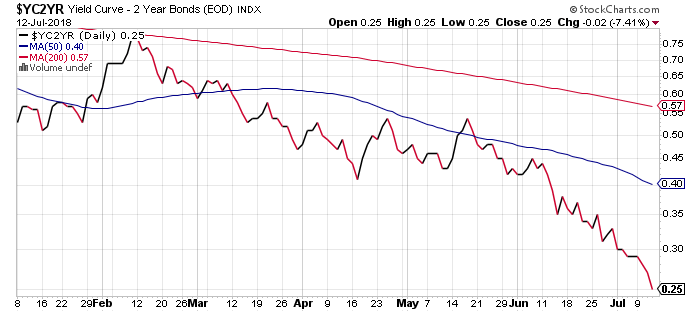
At the year’s start, for instance, the 2-Year Treasury note yielded merely 0.59 percent. As of market close on December 15, that yield had skyrocketed to 4.25 percent. In contrast, the 10-Year Treasury note’s yield rose from 1.35 percent to 3.48 percent over the same period.
It is essential to recognize that both the CPI report and the federal funds rate are shaped by central planning forces. They reflect a retrospective outlook rather than prognostications. Thus, genuine insights about the economy—and even the stock market—are better revealed through the Treasury market.
The fact that the 2-Year Treasury yield (4.25 percent) currently exceeds that of the 10-Year Treasury (3.48 percent) signals an unusual market condition. Typically, longer-term securities offer higher yields due to the accompanying risks. A yield curve inversion—where long-term rates fall below short-term rates—often clues investors into a recession ahead, as it indicates that investors foresee long-term yields declining.
The Treasury Market vs. the Stock Market
The Treasury and stock markets function differently. The Treasury market is driven by strict analysis and logical reasoning, while, as Warren Buffett noted in his 1987 letter to Berkshire Hathaway shareholders, “in the short run, the [stock] market is a voting machine but in the long run, it is a weighing machine.”
This highlights how stock investors often overlook fundamental business indicators, choosing instead to be swayed by sentiment, speculation, trending news, and historical economic data. Consequently, the collective judgment of Treasury investors is generally regarded as more astute. Currently, they seem to anticipate a recession on the horizon.
Indicators supporting this perspective include significant layoffs within the tech sector, a 3.3 percent annual decline in the previously booming used car market, and a 36 percent drop in West Texas Intermediate crude oil prices over the past seven months, all occurring amidst escalating geopolitical tensions.
These circumstances could either be mere coincidences or they could point to an economy heading for trouble.
Earlier this year, the U.S. economy briefly dipped into recession, which may have served as a precursor for more severe downturns ahead. For stock market investors, it should matter little whether the Fed continues its rate hikes or pauses. If the economy is contracting and earnings are weakening, the marketplace is likely to shift from a voting machine into a weighing machine, revealing a rather dismal reality.
At this juncture, it would be prudent for stock investors to heed the warnings from Treasury note investors, as the music they’re playing suggests a troubling tune lies ahead.
Editor’s Note: Being prepared for potential market shifts is crucial to safeguard against significant losses. Simple, practical steps to protect your wealth and financial privacy can be found in the Financial First Aid Kit. For more details on this essential publication, visit us today!
Sincerely,
MN Gordon, for Economic Prism
Return from The Do-Re-Mi of Treasury Notes to Economic Prism